

Detailed Import Data Analytics Reveal Hidden Global Trade Opportunities
2026-11-16
A sharp rise in imports rarely announces itself. It shows up quietly in shipment volumes, supplier changes, and buying patterns that most trade reports overlook. That is exactly where hidden global opportunities tend to sit. While competitors rely on broad summaries, granular import data analytics can reveal which markets are gaining momentum and which buyers are switching sources. Tendata helps you read those signals early so your next move is based on evidence, not guesswork.
Secondary Supply Hubs Are Growing Quietly
A decade ago, places like Hai Phong, Monterrey, and Lodz rarely appeared on the same map. Today they share a quiet trait: warehouse leases are being signed before the roads are fully paved, and local freight forwarders no longer have to explain their location to overseas buyers. The shift is not dramatic, but it shows up in small signals—longer queues at regional customs offices, more night flights carrying components rather than finished goods, and a steady rise in bilingual job postings for production planners.
What makes these secondary hubs attractive is usually not headline policy but accumulated friction elsewhere. Congestion at major ports, rising wages, and the need to keep inventory closer to end customers push sourcing teams to test locations that were once overlooked. These places rarely win on a single factor; they win because they can move a shipment from factory floor to port in under a day, or because a supplier park has enough available power and water without a two-year wait. Once that small advantage is discovered, it tends to spread through buyer networks by word of mouth rather than through promotional campaigns.
The quiet growth also means data lags behind reality. Official trade figures often miss intra-regional flows or rely on outdated industrial classifications, so executives who wait for confirmation in quarterly reports may arrive after rents have already climbed. The more useful signals are operational: truck turnaround times at border crossings, the number of new forwarding branches in a secondary city, or whether local packaging suppliers are expanding their shifts. Watching those details reveals the next tier of supply hubs long before they become obvious.
A Product Code Can Tell You Where Demand Is Moving
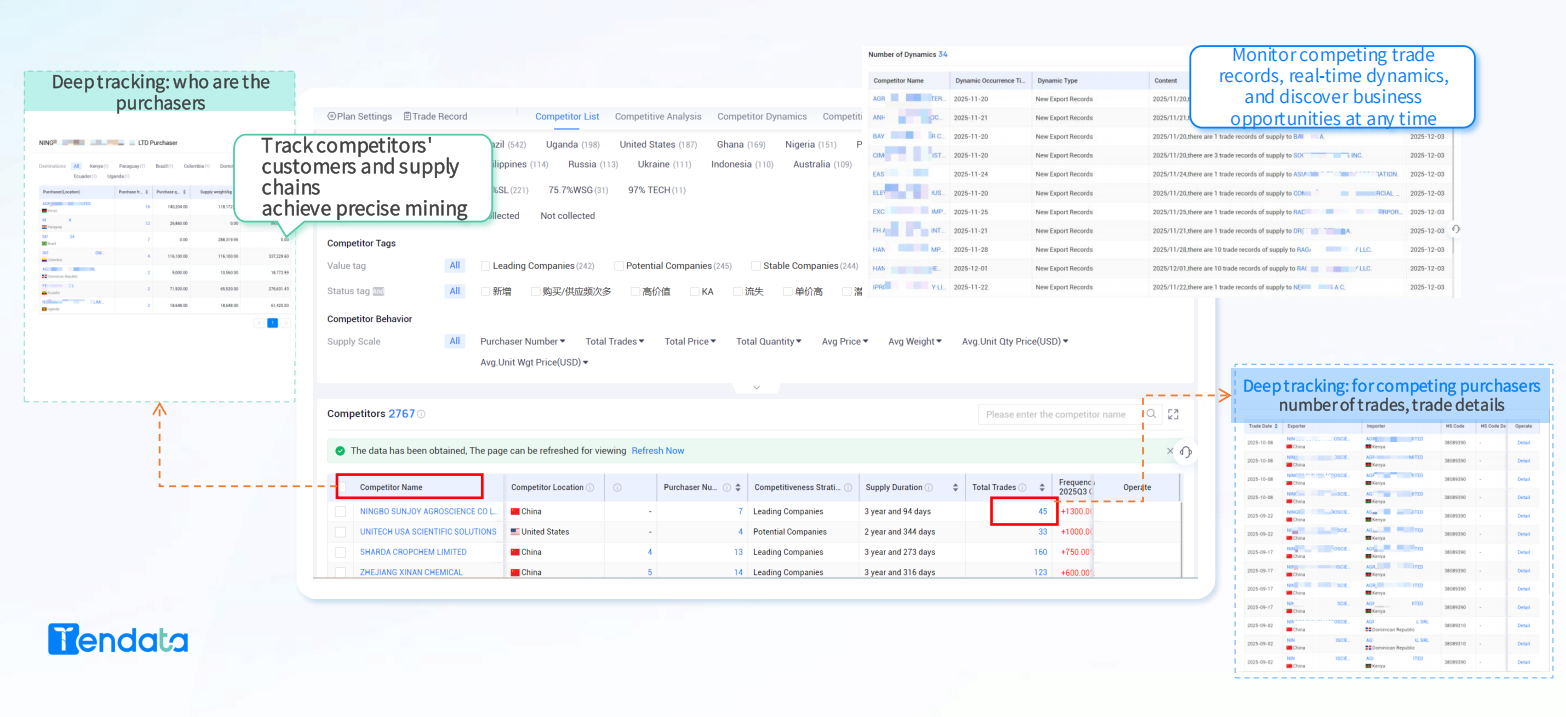
Most retailers treat a product code as a back-office label for inventory tracking. But if you read the structure closely, the sequence often carries signals about regional allocation, sizing runs, or seasonal colorways. A sudden shift in which codes are getting reorders tells you more than a sales chart ever will.
When demand starts creeping into adjacent codes, it rarely happens by accident. Buyers start substituting, warehouse picks shift, and the same base style begins moving under a slightly different variant. Spotting that movement early lets you adjust open-to-buy, rebalance distribution, or even flag a trend before your competitors notice the same inventory holes.
The trick is to stop treating codes as fixed identifiers and start reading them as a running narrative. Which digits are changing first? Are the changes concentrated in a particular region or channel? Those micro-shifts are often the earliest warning that demand is rotating, not growing, and reacting a week early can be worth more than any forecast revision.
Why Some Import Declines Are Actually Good News
A drop in import volumes often triggers alarm, but the story behind the numbers can point to healthier local production. When businesses begin sourcing more components or finished goods domestically, import figures naturally fall. That shift usually means factories are running fuller schedules, wages are being paid to nearby workers, and supply chains are less exposed to distant bottlenecks. Rather than a sign of shrinking demand, the decline can reflect a quiet rebuilding of industrial capacity.
The quality of what is imported matters just as much as the quantity. A country might import fewer consumer gadgets while increasing shipments of precision machinery or raw materials used in advanced manufacturing. In that case, the lower headline number hides a more productive mix. Imports that help local firms upgrade equipment, automate lines, or develop new products tend to generate more value over time than finished items that simply fill store shelves.
Timing also plays a role. After a period of heavy stockpiling, warehouses are full and buyers pause new orders. That correction can look like weakness in monthly trade data, but it often prevents deeper inventory gluts later. A modest decline gives ports and trucking networks a chance to reset rates and clear backlogs, which makes future trade flows more stable. Softer import numbers can therefore be an early signal of a supply chain regaining its balance rather than losing its footing.
Tariff Shifts Leave Footprints in the Data
Tariff changes rarely arrive without leaving traces. In customs filings, the first signal is often a sudden jump in clearance volume for certain HS codes as importers rush to beat a scheduled duty increase. These spikes can appear weeks before an official announcement filters into policy documents, and they tend to be lumpy, concentrated in a narrow band of product categories rather than spread across the whole trade account.
The footprints also show up in less obvious places. Unit values shift when shippers reclassify goods or alter declared country of origin to avoid a higher rate. Vessel schedules and transshipment hubs register unusual activity because cargo that once moved directly between two ports now takes a detour through a third country. These adjustments leave small but consistent mismatches between partner-country export records and domestic import data, which are hard to erase retroactively.
Reading these patterns requires restraint. A single anomaly might reflect a supply disruption, a currency swing, or a one-off contract. But when several indicators align with the timing of a tariff shift—clearance spikes, origin-code churn, unit-value drift, and rerouted freight—the data begin to point in one direction. The tariffs themselves may be announced in official language, but their operational consequences are already visible in shipping ledgers and customs entries long before the policy debates settle.
Spotting Supplier Stress Before It Hits Your Orders
Most supply chain breakdowns don't start with a missed shipment. They begin quietly, weeks earlier, in the way a supplier communicates. Replies get shorter, lead times creep from vague to evasive, and the person who used to solve problems quickly now needs several follow-ups just to confirm a date. Those small shifts are easy to ignore when the order book still looks healthy, but they often signal that cash flow, labor, or raw material problems have already taken hold behind the scenes.
Beyond communication, watch for changes in how a supplier behaves commercially. A request for earlier payment, a sudden willingness to accept smaller orders, or uneven quality on routine items can indicate that a factory is scrambling to cover fixed costs. Inconsistent packaging, more frequent last-minute substitutions, and delivery times that slowly stretch from days into weeks are warnings. None of these alone proves a supplier is in trouble, but together they form a pattern that deserves attention before it turns into a shortage.
The most effective buyers treat this as an ongoing read rather than a quarterly review. Keep a simple log of response times, quality rejections, and any unusual payment or scheduling requests. When two or three of these indicators move in the wrong direction at the same time, reach out directly and ask about current capacity and material availability. That conversation, held early, gives you time to qualify a backup source, adjust inventory, or offer support that keeps the relationship intact.
Port-Level Anomalies Often Arrive Months Early
Long before quarterly trade figures show a slowdown, dockside rhythms shift in ways that are easy to miss. At several European container terminals, reefer boxes began sitting three to five days longer than usual while vessel schedules stayed intact. That small shift in dwell time looked like a scheduling quirk, but it was actually one of the earliest signs that downstream cold storage demand was weakening.
The same pattern appears in gate traffic. A terminal in Savannah might log fewer late-night truck visits per vessel call, or a port in Vietnam may see empty container returns outpace laden pickups for two consecutive weeks. None of these alone proves a downturn is coming. Stacked together, however, they form a picture months before retail import volumes fall, because ports process the physical decisions that importers have already made but have not yet reported anywhere.
What makes these anomalies useful is their banality. They live in ordinary operational data such as crane moves per hour, chassis turnaround, and the share of containers leaving without an inland rail booking. Once those metrics drift outside their normal band for a specific terminal, the divergence often persists quietly for eight to twelve weeks before it shows up in official trade statistics. Reading that early drift requires treating each port not as a passive node, but as a sensor with its own habitual tempo.
FAQ
Most people stop at total units or value. The real signal sits lower: country of origin versus country of consignment, port-level flows, tariff classification changes, shipment frequency, and unit price spread across suppliers. That is where sourcing shifts, price anomalies, and demand pockets surface before they appear in retail reports.
A small product code with 40% year-on-year growth but thin absolute volume is often a better lead than a giant category growing at 3%. Also watch for sudden import spikes from a country that lacks matching local consumption, unusual transshipment routes, and wide unit-price gaps between two suppliers shipping the same goods.
Pick three to five HS codes that matter to your business and track them obsessively in free or low-cost trade databases. A pivot table in Excel is enough to spot seasonal patterns, supplier concentration, and price drift. Ask your customs broker for classification-level anomalies; they see discrepancies daily but rarely get asked about them.
Treating the exporting country as the country of origin. A lot of cargo is routed through hubs like Singapore or the Netherlands, so the real supplier can be hidden. Other traps include ignoring re-exports, reading quarterly spikes as demand when they may be inventory building, and comparing unit prices across years without adjusting for currency swings.
Imagine a home goods company noticing that imports of a particular natural fiber rug from India had quadrupled over three years while local retailers still positioned it as a niche ethnic item. By moving early into a dedicated line and simplifying the supply chain, the company could capture a segment before bigger players saw the same numbers.
Value density per kilogram, import concentration among buyers, volatility of month-to-month flows, price gap between alternative suppliers, and the share of shipments cleared under bonded versus direct entry. Volume alone hides whether the trade is healthy or just a few large contracts that can vanish.
One customs dataset can be misleading. Match it against local consumption figures, inventory cycles, and conversations with forwarders or distributors. A signal becomes worth acting on when at least two independent sources point the same way and the pattern persists for two or three consecutive quarters, not just one.
Conclusion
Import data tends to be read as a record of what already happened, but when it is broken down by port, product code, and timing, it starts to act more like an early-warning system. Secondary supply hubs such as Hai Phong, Mundra, and Lazaro Cardenas have been absorbing volume that once moved through larger gateways, and the shift is rarely announced in advance. A jump in a specific six-digit product code at one of these smaller ports can point to a factory relocation or a new sourcing arrangement months before a buyer updates its supplier list. Tariff changes leave similar clues: sudden import spikes ahead of a duty increase, followed by rerouting through intermediate countries, show how trade adapts without waiting for formal policy guidance.
Not every import decline is a warning sign. When a company reduces dependency on a single country for critical inputs, the overall drop may actually reflect healthier diversification and lower concentration risk. The same detailed records can highlight supplier strain before it reaches purchase orders: smaller shipment sizes, erratic invoice values, or shifts in packaging units often precede more visible delivery failures. At the port level, slower container turnaround, unusual clearance delays, or a quiet fall in outbound truck activity can appear in customs timestamps months before official disruption notices. Taken together, these patterns give importers a clearer sense of where capacity is building, which lanes are softening, and where the next supply problem may be forming.
Contact Us
Contact Person: Grace
Email: [email protected]
Tel/WhatsApp: +86 18721992033
Website: https://www.tendata.com